You may have heard that the WAN Market Size Report just got a brand-new feature—the WAN Market Size Report Forecast.
Predicting global, regional, and country level data for the next five years, this first edition takes the data from the 2021 report and extrapolates it to 2026.
Here’s how we did it.
Our predictive model used our 2021 WAN Market Size framework as the baseline and drew our assumptions forward five years to 2026, based on trends we have collected since 2018.
The key assumptions that influenced the results are:
In this run, we assumed a slight increase in prices (5% annually) because of current global inflation. Should this not end up being the case and prices go back to their normal pattern of falling each year, we will adjust future models accordingly.
It is also important to note that we assumed certain factors will likely stay substantially the same over the next five years, or will not impact global revenue:
- Global site counts for the 5,000 largest companies
- Geographic mix: the percentage of sites in each region or country
- Backup strategies and CoS mix for MPLS
- Local access distances: percentage of sites with in each access distance range by country
- SD-WAN prices: unlike network prices, we assumed SD-WAN encrypted throughput pricing will be flat over the next five years
To run the model, we simply took the same Monte Carlo simulation that we used to construct the original 2021 model and ran it separately for each successive year with new assumptions.
Global WAN Connectivity Market Shares: 2021-2026
Our model indicated that the global WAN market for the largest (nearly) 5,000 companies in the world will grow from $59 billion in 2021 to $85 billion in 2026.
Revenue from port charges, SD-WAN, and broadband will grow and access will go down.
Port charges in the context of the below chart include all network charges for MPLS and DIA service. Access includes local loops connected to both MPLS and DIA ports.
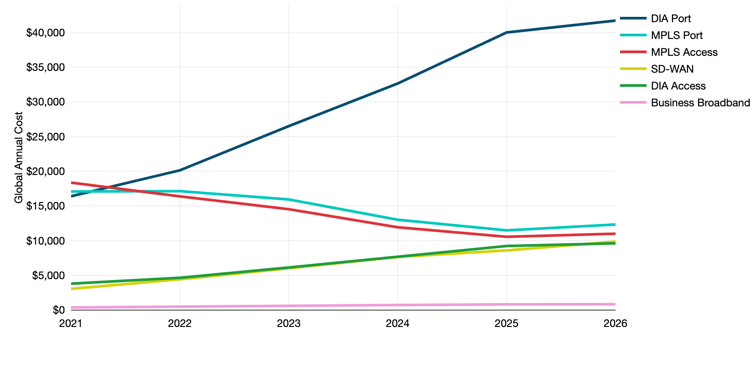
Global WAN Market Size Forecast by Specific Product
As enterprises continue down the path of digital transformation and cloud services become the norm, internet connectivity service will very likely continue to take center stage in the WAN.
Our survey results, conversations with industry players from both the buy and sell sides, benchmarking customers, and cataloging of carrier offerings all indicate that MPLS will diminish as the center of the WAN and be supplanted by internet service.
Thus far, we have found DIA to be decidedly the most common choice for enterprises, as they still want carrier-grade SLAs and service reliability.
Of course, this could change if substantially more fiber-based broadband plans emerge in the next five years, but as things stand, it appears very much that DIA will replace many MPLS ports in the coming years. As such, it is no surprise that DIA and MPLS will switch places as the key revenue sources in our model for the next five years.
Global Revenue Forecasts for Specific WAN Products: 2021-2026 (USD millions)
 Notes: Each line represents the median model run for the listed WAN products across each year’s
 model runs. Prices are in millions of US dollars. Source: TeleGeography, © 2022 TeleGeography
Regional WAN Connectivity Market Shares: 2021-2026
Our 2021 WAN Market Size Report revealed that East Asia dominated the world market, driven mostly by China. This remained in effect and will actually increase in the forecasted model.
China is a huge market where many enterprises must have operations—often with significant bandwidth—despite the sky-high prices that result from the uncompetitive market.
Recall that our forecast assumes the same regional and country distributions of sites for WAN services for the next five years. So, changes in regional contribution come from either SD-WAN or the relative prices for different products at different bandwidths across regions.
In this case, it is apparent that the shift to DIA will have a large impact on prices for China and East Asia, where DIA service is a higher price relative to other geographies.
Regional Total WAN Market Size Distribution Forecast: 2021-2026
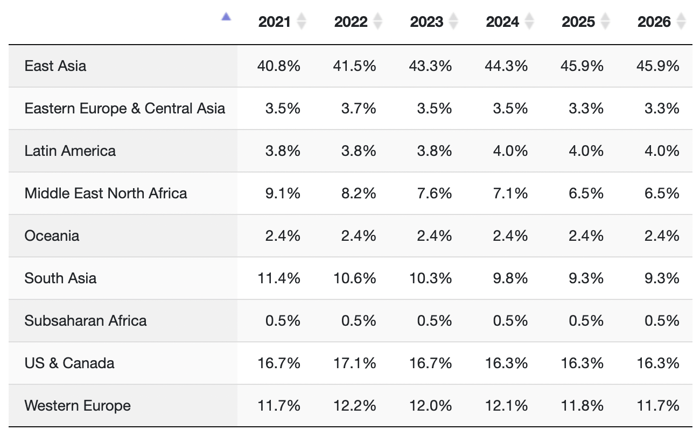
Notes: Table demonstrates the percentage that each region contributed to the global WAN market
revenue in the median model run for the listed year. Source: TeleGeography, © 2022 TeleGeography
- East Asia will grow from 41% to 46% of the market.
- The Middle East and North Africa will shrink from 9 to 6.5%.
- Most other regions will stay about the same over the five years of model runs.
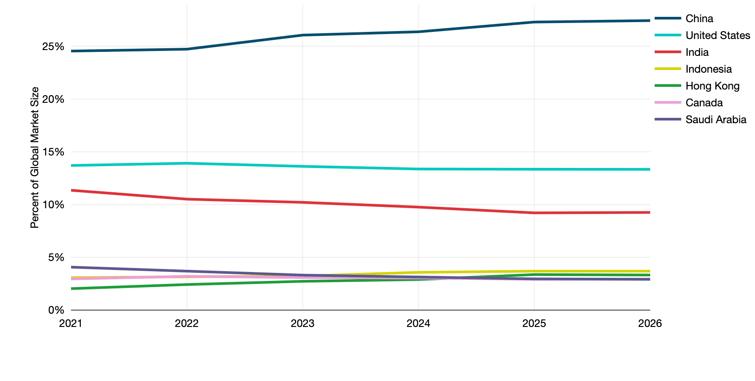
Country WAN Connectivity Market Share: 2021-2026
Many countries will stay somewhat in the same positions, but grow in revenue along with the global trends.
To emphasize again, we did not adjust the assumptions about office geography between 2021 and 2026 (i.e., we assumed roughly the same number of offices in any given country across all years). The changes will come from the impacts of product and bandwidth substitutions over those years.
As products switch away from MPLS and toward DIA, the different pricing dynamics of those services, especially how they are priced at higher bandwidths, impacts revenues.
Among the top ranked countries, China will have the biggest increase, but that will only be 3%.
Top Ten Countries by WAN Revenue: 2021-2026
 Notes: Each line represents the total WAN market size for the listed country across the median
 model runs for each year. Source: TeleGeography, © 2022 TeleGeography
To continue reading this Executive Summary,
download the full version.